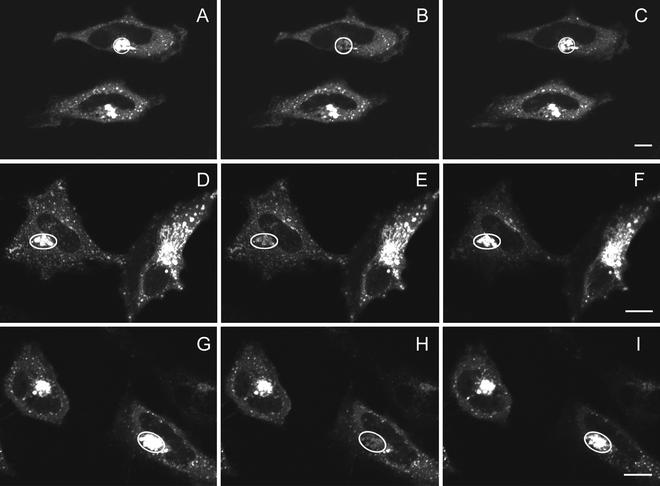
Figure 10.
Fluorescence recovery after photobleaching of GFP-GGA1 at the TGN of cells under different conditions at 37°C. HeLa cells were imaged for GFP-GGA1 before photobleaching (A, D, and G), immediately after photobleaching (B, E, and H), and 2 min (C, F, and I) after photobleaching in control cells (A–C), in cells K+ depleted (D–F) or treated with hypertonic sucrose (G–I). The photobleached area is indicated in each figure. Bar, 12 μm.

