Figure 6.
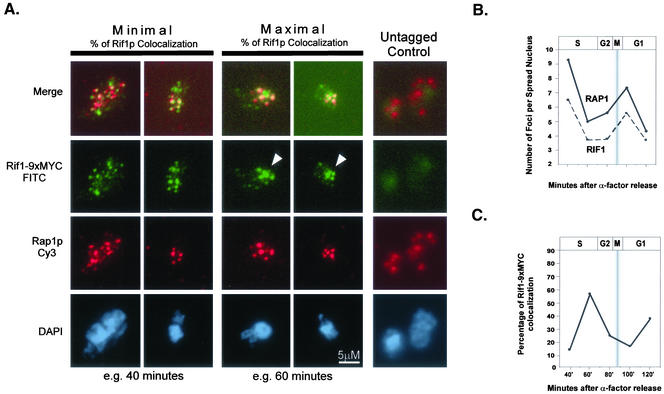
RAP1 and RIF1 colocalize and cluster through the cell cycle. α-Factor synchronized cultures were released into the cell cycle and collected at 20-min intervals. Spheroplasts were spread on glass slides and immunofluorescence performed for Rap1p (Cy3, red) and Rif1–9xMYC (FITC, green). Representative examples of maximally colocalized and minimally colocalized spots are shown as well as untagged control (A). White arrowheads indicate large, clustered Rif1–9xMYC foci (A). The average number of Rap1p and Rif1–9xMYC foci per nucleus was quantified for each time point (B). The percentage of Rif1–9xMYC colocalization to Rap1p through the cell cycle was also quantified (C). The approximate stage of the cell cycle, as determined by budding indices is shown above graphs. Shaded bar in B and C represents the approximate range of mitosis.

