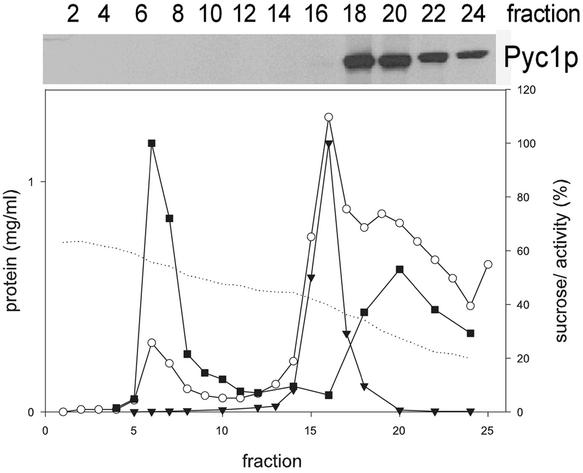
Figure 6.
Sucrose gradient, prepared from a postnuclear supernatant obtained from methanol-grown H. polymorpha WT cells. The graph shows the distribution of the peroxisomal marker enzyme AO (+), the mitochondrial marker enzyme cytochrome c oxidase ([itrig]), the protein (0) and sucrose concentrations (dotted line). The Western blot shows the distribution of HpPyc1p in the even fractions of the gradient. The protein was only detected in the upper part of the gradient (fractions 18–24), which corresponds to the cytosol. Sucrose concentrations are expressed as % (wt/wt), the protein concentrations as mg/ml and the specific activities of AO and cytochrome c oxidase as percentages of the value in the peak fractions that were arbitrarily set at 100.

