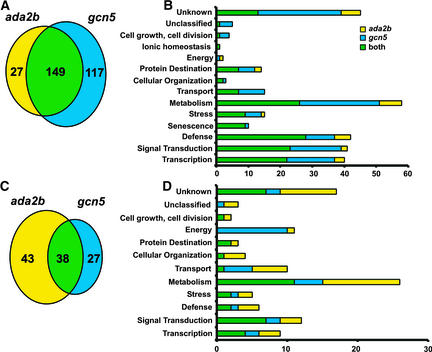
Figure 7.
Gene Expression Profiles of ada2b-1 and gcn5-1 Mutations.
(A) and (B) Venn diagram (A) and functional categories (B) of genes with increased expression in ada2b-1 and gcn5-1 mutants.
(C) and (D) Venn diagram (C) and functional categories (D) of transcripts with decreased expression in ada2b-1 and gcn5-1 mutants.

