Figure 1.
drl1-2 Leaf Phenotype.
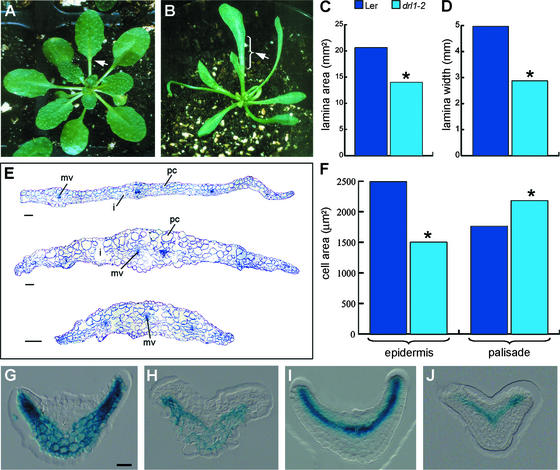
(A) and (B) Fully grown rosettes of wild-type (A) and drl1-2 (B) plants. Arrowheads indicate the transition between the lamina and the petiole.
(C) and (D) Mean values of lamina area (C) and lamina width (D) of first and second expanded leaves of normal length. Asterisks indicate statistically significant differences between mutant and wild-type samples (t test, P ≤ 0.05).
(E) Transverse sections at the widest locations of expanded lamina of first leaves of wild-type (top) and drl1-2 (middle and bottom) plants. i, intercellular space; mv, midvein; pc, palisade cells.
(F) Mean values of cell area of upper epidermis and palisade cells in cleared expanded first and second leaves. Asterisks indicate statistically significant differences between mutant and wild-type samples (t test, P ≤ 0.05).
(G) and (H) GUS activity of the pFIL-GUS ventral marker in wild-type (G) and drl1-2 (H) plants.
(I) and (J) GUS activity of the pREV-GUS dorsal marker in wild-type (I) and drl1-2 (J) plants.
Bars = 50 μm for (G) to (J) and 100 μm for (E).

