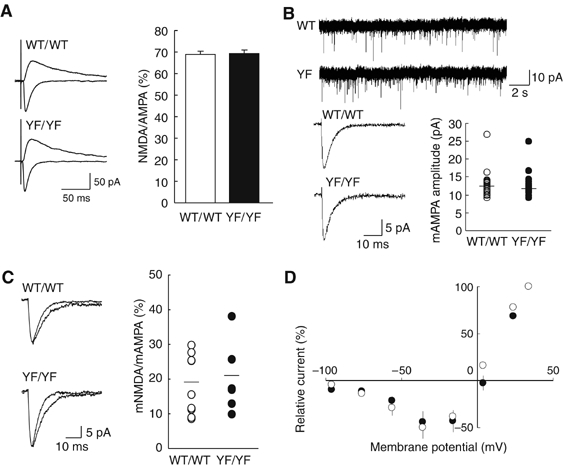
Figure 4.

Normal basic properties of synaptic transmission in YF/YF mice. (A) Sample traces (average of 10 traces) of evoked AMPAR-mediated (downward traces) and NMDAR-mediated (upward traces) EPSCs in WT/WT and YF/YF mice (left). Ratio of amplitudes of NMDAR-mediated EPSCs to those of AMPAR-mediated EPSCs (right) (WT/WT mice, n=9; YF/YF mice, n=12). The ratio was calculated for each cell, and the values were then averaged for all cells. (B) Unaltered AMPAR-mediated mESPCs in YF/YF mice. Sample traces showing multiple events on a slower time scale (top). Averaged traces of mEPSCs recorded from single neurons (consecutive 100 events are averaged for WT/WT mice; consecutive 82 events for YF/YF mice) (bottom, left). Summary of the mean amplitude of AMPAR-mediated mEPSCs (bottom, right) in WT/WT (n=23) and YF/YF mice (n=20). Horizontal bars indicate the means. (C) Sample traces of AMPAR-mediated mEPSCs (faster traces) and AMPAR-plus NMDAR-mediated mEPSCs (slower traces) in WT/WT (average of 28 traces for AMPA and NMDA mEPSCs; average of 50 traces for AMPA mEPSCs) and YF/YF (average of 53 traces for both AMPA and NMDA mEPSCs and AMPA mEPSCs) mice (left). Ratio of the mean amplitude of NMDAR-mediated mEPSCs (AMPA mEPSCs were digitally subtracted from AMPA plus NMDA mEPSCs) to that of AMPAR-mediated mEPSCs (WT/WT, n=9; YF/YF, n=7). Horizontal bars indicate the means. (D) Current–voltage relationships of evoked NMDA synaptic currents recorded in the presence of 10 μM CNQX in WT/WT (n=5) and YF/YF (n=5) mice. The current values were normalized to the value at +34 mV in each cell, and the values were then averaged for all cells. The liquid junction potential was compensated.
