
Figure 3.
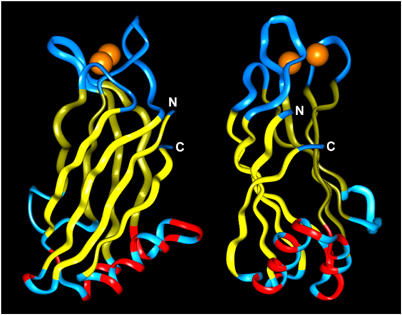
Ribbon diagram of the C2B domain of rabphilin: identification of the SNAP-25 binding site defined by chemical shift changes. The figure displays views of the rabphilin C2B domain with a 90° rotation around the vertical axis. The Ca2+-binding loops are shown on top with two Ca2+ ions bound (orange; Ubach et al, 1999). β-Strands are displayed in yellow. Residues that changed upon SNAP-25 binding are shown in red. Note that these changes are restricted to the bottom α-helix and the adjacent bottom loop. N- and C-termini are indicated by white ‘N' and ‘C'.