
Figure 2.
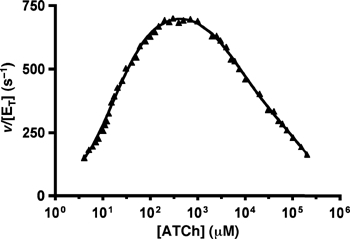
pS curve for ATCh hydrolysis by TcAChE. The rate of hydrolysis (triangles) is shown as a function of ATCh concentration. The data were fitted (plain line; global correlation coefficient of 0.9984) by using an equation based on a model accounting for two different substrate inhibition phenomena (Stojan et al, 2004). The following set of kinetic parameters describes the data: acetylation rate: k2=65300 s−1; deacetylation rate: k3=872 s−1; substrate affinity for the PAS: KP=136 μM; ratio of substrate molecules at the PAS sliding to the CAS of the free enzyme: 1/KL=0.089; ratio of substrate molecules at the PAS sliding to the CAS of the acetylenzyme: 1/KLL=0.0016; coefficient for activation of deacetylation due to the PAS being occupied by a substrate molecule: a=1; coefficient for inhibition of choline exit due to the PAS being occupied by a substrate molecule: b=0.008. The transition between the two-substrate inhibition mechanisms was calculated to occur at around 100 mM (see Supplementary data for details).