
Figure 7.
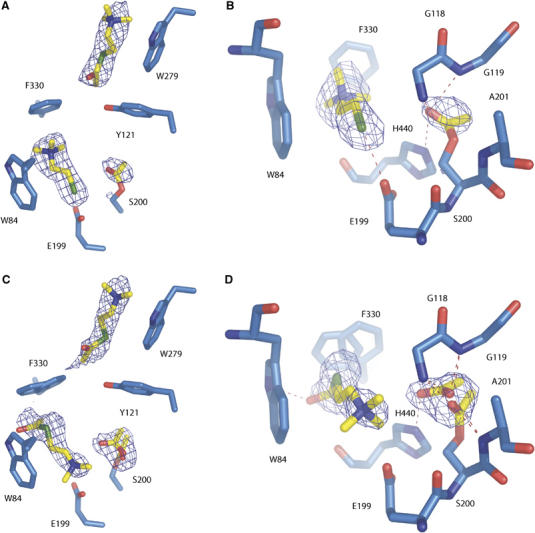
Substrate and product binding sites in substrate-inhibited TcAChE at 20 mM ATCh (A, B) and at 500 mM ATCh (C, D). (A) Overview of the binding sites; (B) acetylation of the catalytic serine and binding of TCh in the active site. The CAS residues (Trp84, Glu199 and Phe330), the oxyanion hole residues (Gly118, Gly119 and Ala201) and the catalytic serine (Ser200) and histidine (His440), are shown. The Fo–Fc electron density map (contour level 4σ), computed without the atomic coordinates of the ATCh and TCh molecules and of the acetyl group linked to Ser200, is superimposed on the model. (C) Overview of the binding sites; (D) acetylation of the catalytic serine and binding of ATCh in the active site. The CAS residues (Trp84, Glu199 and Phe330), the oxyanion hole residues (Gly118, Gly119 and Ala201) and the catalytic serine (Ser200) and histidine (His440) are shown. The Fo–Fc electron density map (contour level 4σ), computed without the atomic coordinates of the ATCh molecules and of the acetyl and acetate groups, is superimposed on the model.