
Figure 8.
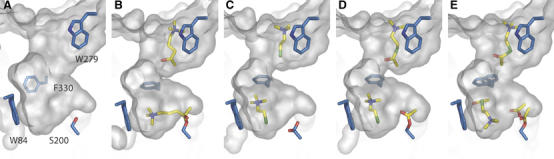
Molecular surfaces of the active-site gorge in native TcAChE (A), and in the OTMA/TcAChE (B), 20 mM TCh/TcAChE (C), 20 mM ATCh/TcAChE (D) and 500 mM ATCh/TcAChE (E) complexes. OTMA, ATCh and TCh are shown as yellow sticks, as is the acetyl group on Ser200 in (D, E).