
Figure 4.
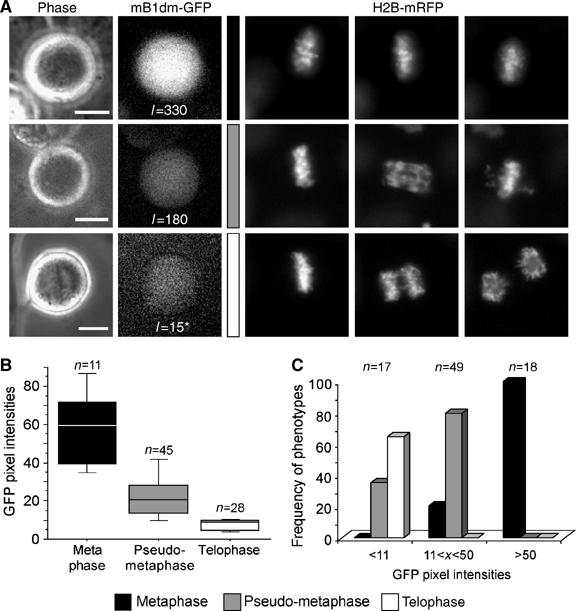
Mitotic arrest phenotypes correlate with cyclinB1 expression levels. (A) Onk2 H2B-mRFP mB1dm-GFP cells were induced for 24 h using 1 μg/ml dox and monitored for progression through mitosis by live cell imaging using a × 40 objective. Representative cells with high, medium and low GFP signals and selected corresponding time frames of histone H2B-mRFP recordings are shown. *Image was contrast enhanced to visualise the GFP signal. (B, C) For quantification, cells were monitored using a × 10 objective. The average GFP pixel intensities in cells displaying one of the three cellular arrest phenotypes is shown in (B), while the relative frequency of phenotypes in groups of cells displaying similar GFP intensities is shown in (C).