Figure 3.
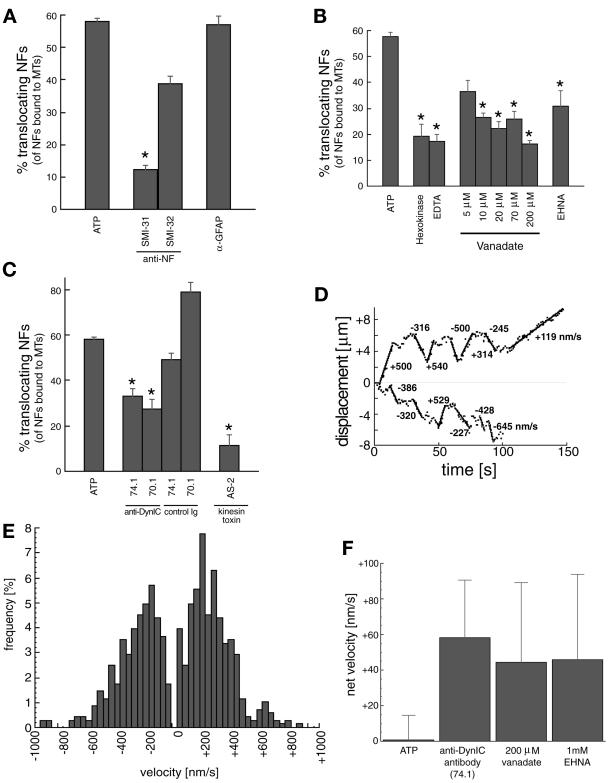
Analysis of neurofilament translocation. (A) Percentage of NFs translocating (of the total bound to MTs) in the presence of 100 μM Mg2+-ATP (baseline) and anti-IF antibodies. SMI31 and SMI32 recognize phosphorylated and nonphosphorylated NF epitopes, respectively. An anti-GFAP antibody is included as a control. Asterisk represents significant change in motility (p < 0.05) versus the GFAP control antibody. (B) NF motility is shown in the presence of ATP depletion by 2 U/ml hexokinase/5.5 mM glucose (Hexokinase) and Mg2+ depletion by 2 mM EDTA. Vanadate sensitivity for five concentrations (5, 10, 20, 70, 200 μM) and effect of 1 mM EHNA are also shown. Asterisks represent significant change in motility (p < 0.05) versus ATP alone. (C) NF transport after preincubation with the two anti-DynIC antibodies 74.1 and 70.1 and the corresponding Ig isotype controls, and a kinesin toxin (AS-2). Asterisks represent significant change in motility (p < 0.05) versus the appropriate control Ig (74.1 and 70.1) or ATP (AS-2). The control Ig values were not significantly different than ATP alone (p > 0.05). Heights of bars in A–C indicate the average (± SEM) of at least 10 independent video sequences comprising at least 150 NFs measured per condition. (D) Trajectories for two representative NFs demonstrate the bidirectional nature of the NF motility. Calculated velocities are shown for various segments of the trajectories. (E) Distribution of velocities of transported NFs in the presence of 100 μM Mg2+-ATP, n = 680 motile events from 90 different NFs. (F) Net velocities (mean ± SE) of NFs in the presence of dynein inhibitors (74.1 antibody, 200 μM vanadate, and 1 mM EHNA) and under control conditions (100 μM Mg2+-ATP), n > 40 motile events for each condition.

