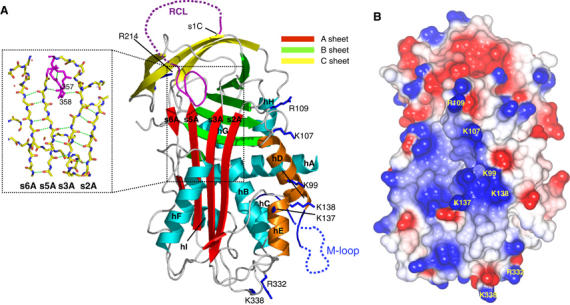
Figure 1.

(A) Cartoon of native MENTWT showing the A β-sheet (red), B β-sheet (green), C β-sheet (yellow), RCL (purple) (the disordered region is dashed) and helices hA–hI (cyan). Residues K99, K107, R109, R332 and K338 are in dark blue bonds (labelled). The partial insertion of the RCL and the break in s6A (dotted rectangle) of the A-sheet are shown in the inset (hydrogen bonds as green broken lines). (B) CCP4MG (Potterton et al, 2002, 2004) electrostatic potential surface of native MENTWT. The positions of K99, K107, R109, K137, K138, R332 and K338 are shown.
