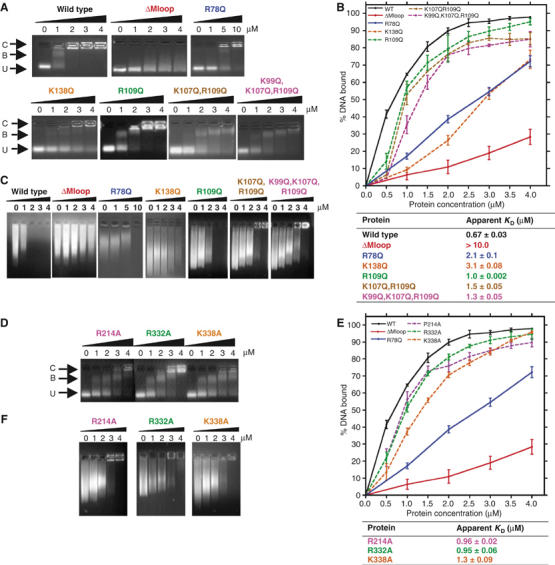
Figure 2.

Analysis of purified MENT proteins incubated with DNA and chromatin. Gel mobility shift analysis of D- and E-helix mutants (A) and alanine mutants (D) in comparison to MENTWT (WT) and two negative control proteins, MENTΔMloop (ΔMloop) and a single AT-hook mutant, MENTR78Q (R78Q) (control proteins only shown in panels A and C). Proteins were incubated with DNA and analysed by agarose gel electrophoresis. The final concentration (μM) of purified proteins, as indicated, is shown at the top of each gel panel. Arrows indicate the position of unbound DNA (U), bound DNA/complex (B) and large nucleoprotein species (C). Quantitative analysis of EMSAs of D- and E-helix (B) and alanine mutants (E) is shown graphically. Graphs represent the % of bound DNA at increasing MENT concentrations (as indicated at the bottom of graph). Graphed data of the control proteins MENTWT, MENTΔMloop and MENTR78Q are shown as solid lines and the mutant proteins as dashed lines. Affinities (KD) were calculated from gel electrophoresis experiments as described in Materials and methods and are defined as the concentration (μM) of protein required to bind 50% of DNA. (C, F) Chromatin association assays with increasing concentrations of D- and E-helix mutant (C) and alanine mutant proteins (F). The final concentration (μM) of purified protein, as indicated, added to soluble erythrocyte chromatin (OD260=1.6) is shown at the top of each gel panel.
