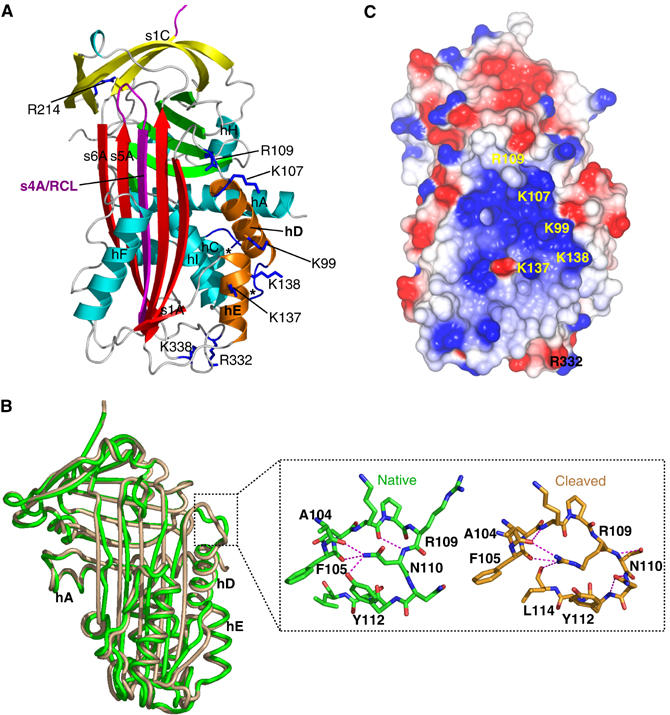
Figure 5.

(A) The structure of cleaved MENTWT labelled as in Figure 1A. The termini of the M-loop (between hC and hD) are indicated by *. (B) Superposition of native (green) and cleaved (brown) MENTWT. The change in conformation at the top of the D-helix is indicated by a dotted square and shown in the inset. Hydrogen bonds are shown by dashed lines and R109, N110, Y112, F105 and A104 are labelled. (C) CCP4MG (Potterton et al, 2002, 2004) electrostatic potential surface of cleaved MENTWT, coloured as in Figure 1B.
