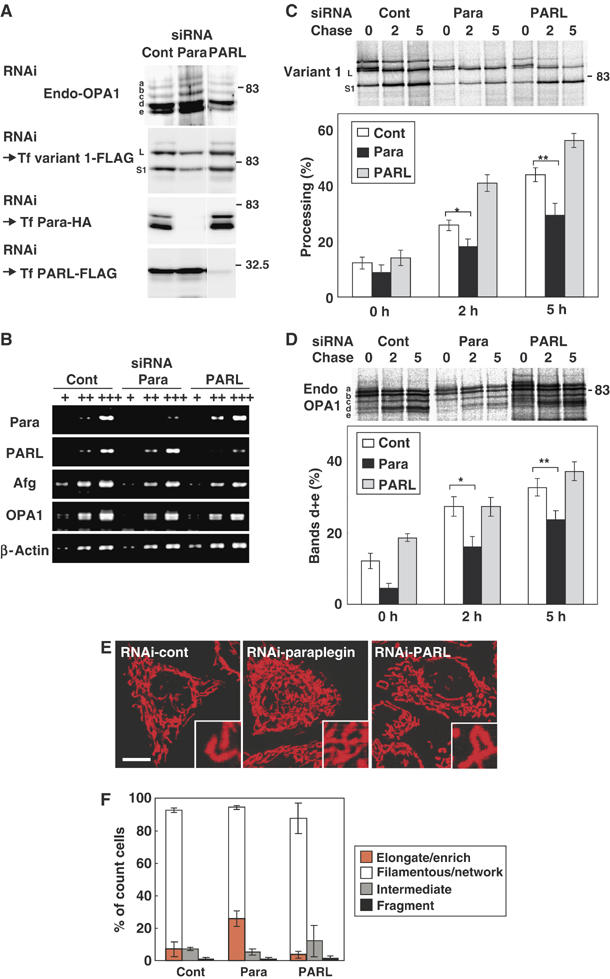
Figure 8.

Knockdown of paraplegin and PARL by RNAi in HeLa cells. (A) HeLa cells were transfected with the siRNA duplex for GFP (control) or the indicated proteases three times. An aliquot of the cells was subjected to immunoblot analysis using anti-OPA1 antibodies (for endogenous OPA1). The other aliquots were transfected with OPA1-variant 1-FLAG, paraplegin-HA, or PARL-FLAG, then analyzed by immunoblotting using anti-FLAG (for OPA1 variant 1 and PARL) or anti-HA antibodies (for paraplegin). (B) The amount of mRNAs for paraplegin, PARL, Afg3L2, and OPA1 were examined by RT–PCR using 100- (+) or 10-fold (++) diluted templates. In all, 200–400 bp fragments were amplified. (C, D) The RNAi cells in (A) were labeled with 35S-Met/Cys mix for 30 min, then chased for the indicated time periods (h). The cell lysates were subjected to immunoprecipitation using anti-FLAG (for OPA1 variant 1; C) or anti-OPA1 (for endogenous OPA1; D). The immunoprecipitates were analyzed by SDS–PAGE and subsequent digital autoradiography as in Figure 1D and E. *P and **P<0.05 in (C). *P and **P<0.05 in (D). (E) HeLa cells subjected to RNAi as above were stained with MitoTracker and analyzed by fluorescence microscopy. Scale bar: 10 μm. (F) The number of cells with highly elongated and enriched mitochondria, filamentous-network, intermediate, or completely fragmented mitochondrial structures in (E) were counted and are shown as a percentage. More than 100 cells were counted for three different optical fields.
