Figure 1.

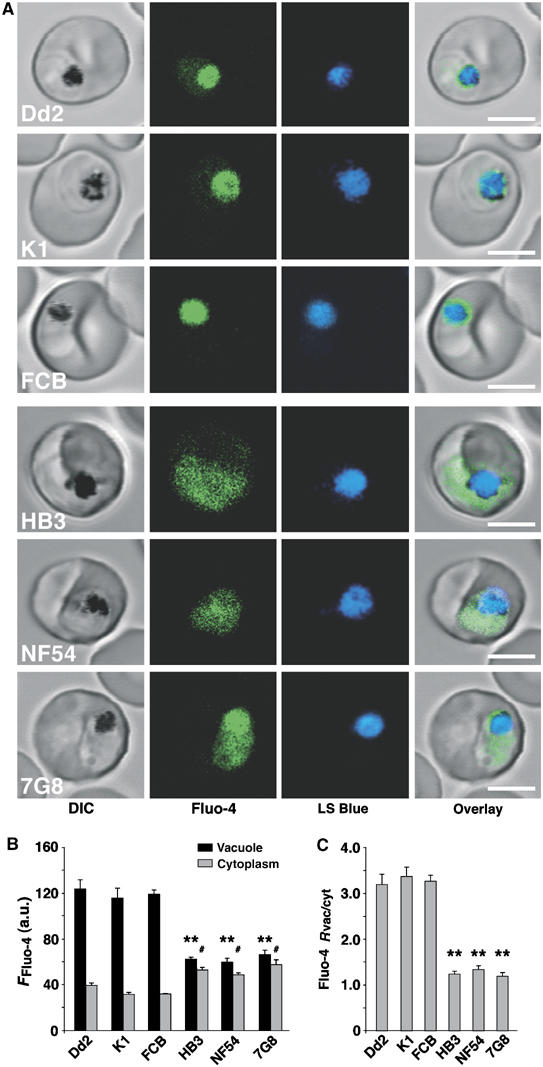
Fluo-4 fluorescence in different P. falciparum parasites. (A) Single images of P. falciparum-infected erythrocytes stained with Fluo-4 AM (green) and the acidotropic dye LS Blue (blue). Bar, 5 μm. (B) Mean Fluo-4 fluorescence quantified from the food vacuolar and cytoplasmic regions. (C) Ratios of the mean Fluo-4 fluorescence signals in the vacuolar and cytoplasmic regions (Rvac/cyt). The means±s.e. of over 15 independent determinations collected over several days are shown in (B) and (C). **P<0.001 and #P<0.05, comparing the vacuole and cytoplasm of the two groups of parasites, respectively.
