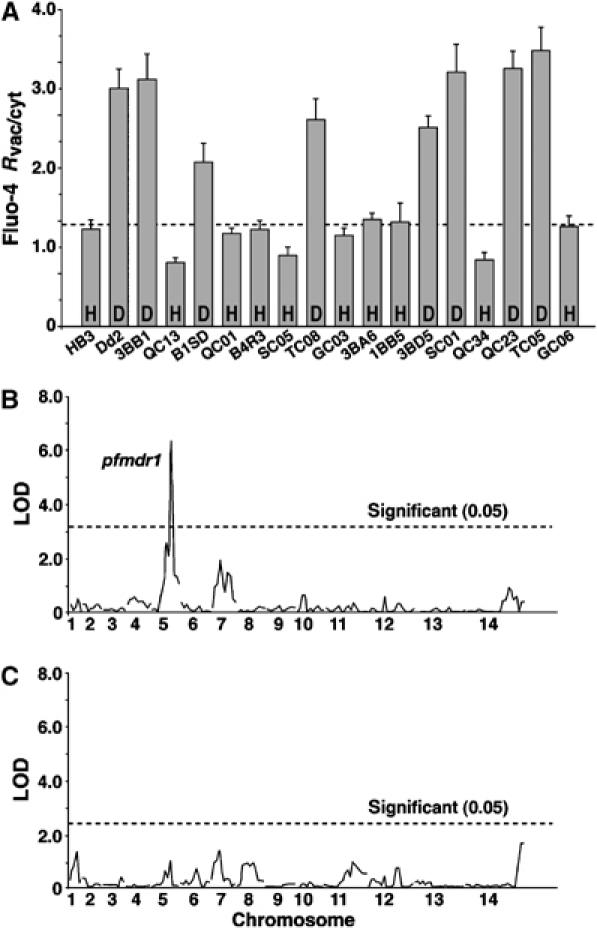
Figure 2.

Linkage of the Fluo-4 phenotype to pfmdr1. (A) Fluo-4 Rvac/cyt in the progeny from the HB3 × Dd2 cross. The dotted line indicates the cutoff level of fluorescence ratio, as defined by HB3. H and D indicate the pfmdr1 haplotypes of HB3 and Dd2, respectively. The mean±s.e. of over 60 independent determinations are shown. (B) QTL analysis of Fluo-4 Rvac/cyt using Pseudomaker. (C) Secondary scan using Pseudomaker to search for minor QTL. Dashed lines represent the threshold values calculated from 1000 permutations (Churchill and Doerge, 1994). The P. falciparum chromosomes are indicated.
