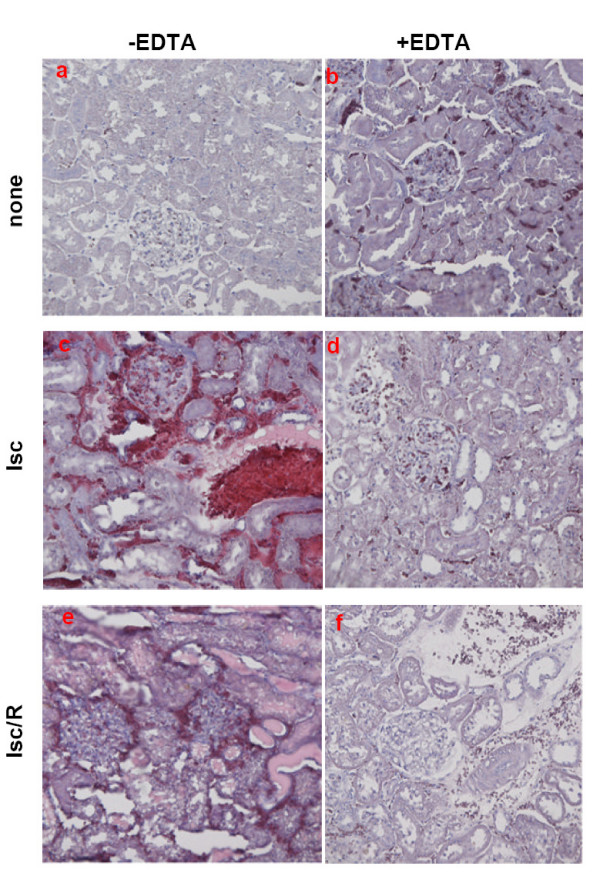
Figure 2.
Renal morphology. Hematoxylin/Eosin images of differently treated rats. lsc = ischemia; lsc/R = ischemia/reperfusion. Representative cortical areas are shown. Notice the abundance of red blood cells and tubular protein casts in c and e panels in comparison with d and f (original magnification × 200).

