
Figure 1.
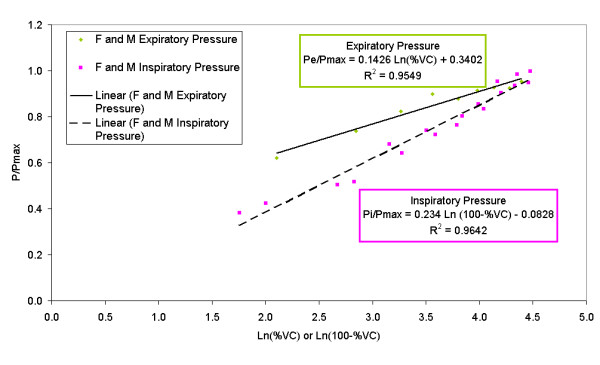
Graph of empirical equations determined to describe relative expiratory and inspiratory pressures for men and women. Some data points are coincident. Symbols: F = female; M = male; other symbols as in text.
Official websites use .gov
A
.gov website belongs to an official
government organization in the United States.
Secure .gov websites use HTTPS
A lock (
) or https:// means you've safely
connected to the .gov website. Share sensitive
information only on official, secure websites.
Graph of empirical equations determined to describe relative expiratory and inspiratory pressures for men and women. Some data points are coincident. Symbols: F = female; M = male; other symbols as in text.