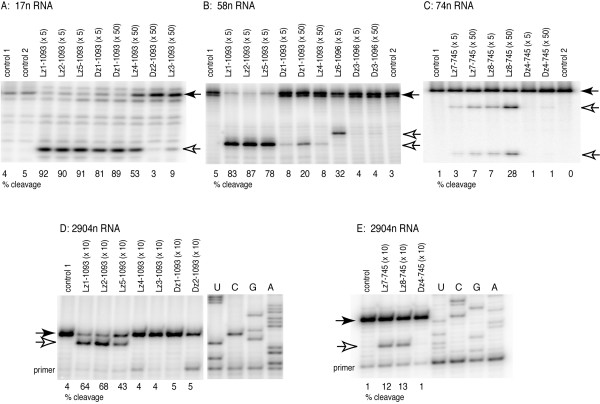
Figure 3.
Gel analysis of LNA- and DNAzyme cleavage of RNA substrates under single-turnover conditions. The uncleaved RNAs substrates (filled arrows) and the cleavage products after one hour (unfilled arrows) are shown for a range of enzyme concentration (molar excess of enzyme in parentheses). No enzymes were added to the control sample, which were analyzed before (control 1) or after incubation (control 2). In A and B, the 17n and 58n RNAs are 5'-radiolabelled; in C, 74n is radiolabelled within the chain; in D and E, the radiolabel in on the 5'-end of the primer used in the reverse transcription reaction (and the bands observed here are thus cDNA transcripts of the 2904n RNA). The lanes U, C, G, and A denote dideoxysequencing reactions. The 58n RNA was partially extended with an extra 3'-nucleotide during T7 transcription (visible as a double band in the uncleaved substrate). The proportions of cleavage product are indicated below each gel lane.

