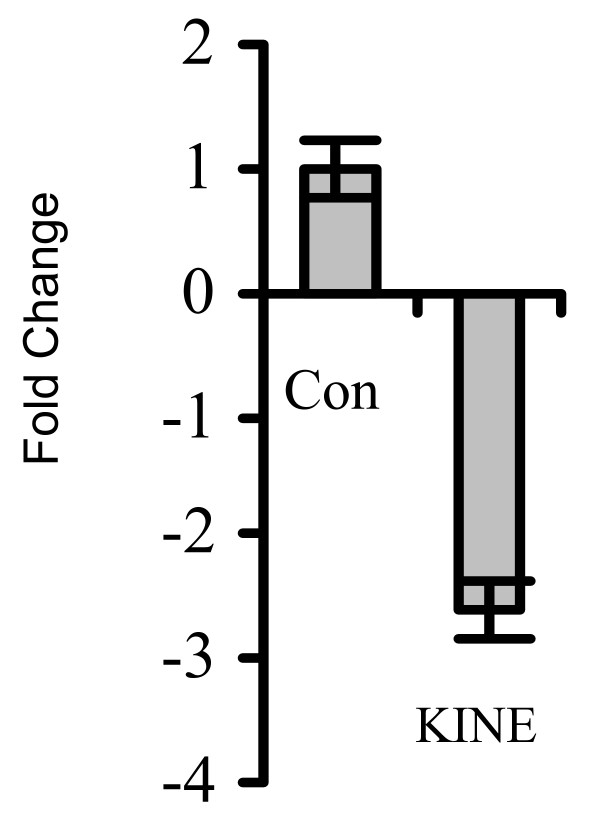
Figure 6.

Real-time PCR analysis of ROM expression in KINE and CON cells. Real-time PCR was conducted to confirm data obtained from microarray analyses. Cycle threshold (CT) values were used to calculate the fold change of mRNA levels of ROM in KINE compared to CON cells. The data indicated that the expression of ROM was reduced in KINE cells by 3-fold over control.
