
Figure 2.
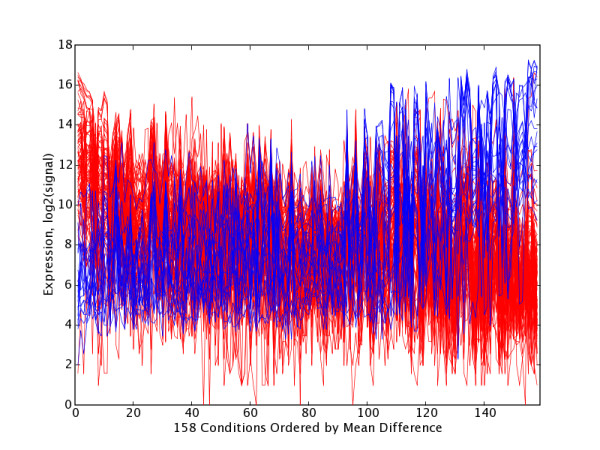
GNF PC7 Extreme Gene Trajectory Plot with Tissues Ordered by Significance. Trajectory plots for high and low extreme gene sets H7 (red, n = 88) and L7 (blue, n = 20) with tissues ordered by decreasing mean(H7) – mean(L7), and thus grouped by significance (UP7 group at left, FLAT7 group in middle and LOW7 group at right) at test1Thresh = 0.05. Table 3 lists the tissues within UP7 and DOWN7 that occur at each end of this plot.