
Figure 3.
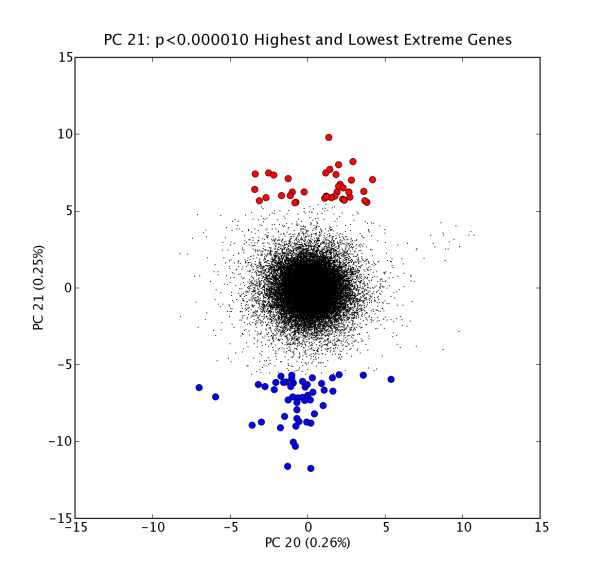
GNF PC21 High and Low Extreme Gene Probes. Scatter plot of N = 33689 probe expression levels projected onto PC20 vs. PC21 space with high and low extreme gene sets H21 (red points, n = 37) and L21 (blue points, n = 49); extreme genes selected at extremeThresh = 0.00001. The extreme genes in L21 are listed in Table 4.