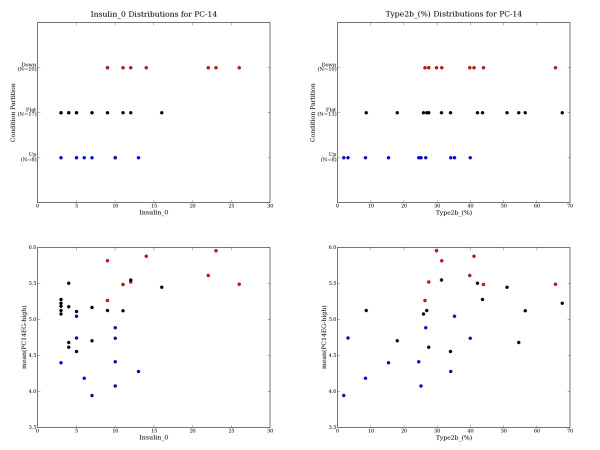
Figure 5.

Diabetes PC14 Sample Partitioning is Correlated with Certain Covariates. When sufficient covariate data is available (a number of the measurements are missing for certain covariates), covariate distributions are compared across partitions and significant differences are reported (as in Table 7). When a covariate is identified as significantly correlated with a principal component's sample partitioning, covariate distribution plots can be generated to further investigate and evaluate the apparent relationship. For example, the diabetes dataset's PC14 extreme genes partition the samples into UP14 (n = 8), FLAT14 (n = 17) and DOWN14 (n = 10) based on their expression patterns. PC14's UP14 vs. {FLAT14+DOWN14} sample partitioning appears related to the Insulin_0 measure (sig = 0.001), and the {UP14+FLAT14} vs. DOWN14 partitioning appears related to Type2b_(%) (sig = 0.008). The mean expression of the PC14EG-high genes appears modestly correlated with Insulin_0 (r = 0.411) and with Type2b_(%) (r = 0.467). UP14 samples are in red, FLAT14 are black, and DOWN14 are blue.
