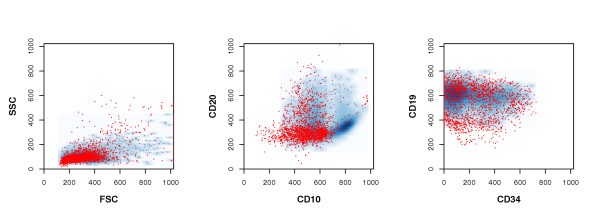
Figure 3.

Leukemic cells detected solely by the SVM. In this figure, the distribution of those cells, which were deemed to be physiological blood cells by conventional gating, but classified as leukemic by the SVM (red dots) is displayed. For comparison, to the density distribution of those cells deemed leukemic by both methods is also shown (blue background densities). The darker a blue area is, the more confirmed leukemic cells lie within that area.
