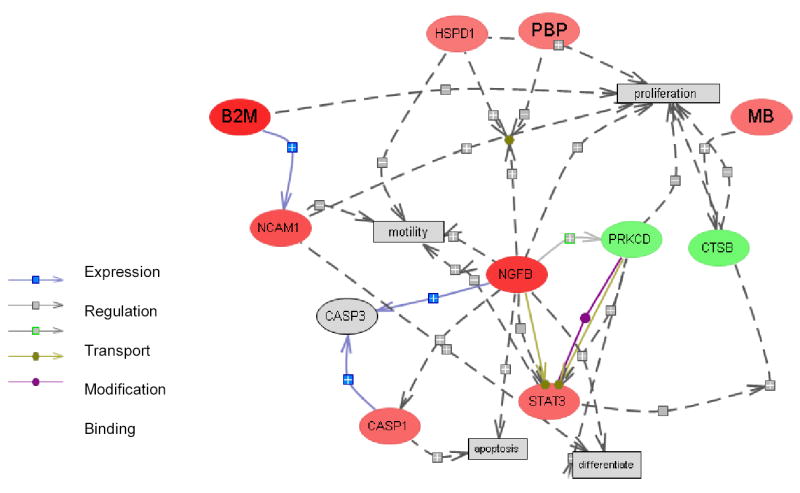
Figure 3.

The “focus” biological association networks constructed using differentially regulated proteins with abundance ratio (perturbed/Control) > 1.5 or <0.67, with multiple unique peptides identified, and with a coefficient of variation < 0.6 were included. A. Network modified by caffeine treatment starting from 60 days of age. Two molecular processes, Akt phosphorylation and cell proliferation, were identified as downstream of multiple proteins in the network. B. Network modified by genetic variation present in DBA/2J F1 mice. Protein expression ratios are indicated by node color. Red: low-metastatic/high-metastatic > 1.5; Green: low-metastatic/high-metastatic < 0.67; Gray: ratio not determined or not considered to be different. The modes of interactions among the proteins were listed in the legend. Positive association and negative associations were indicated as “+” or “−” sign inside the interaction nodes.

