Figure 2.

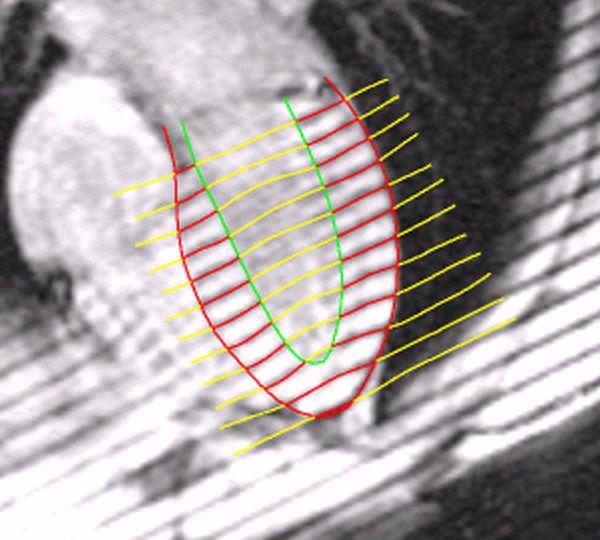
Long axis image at end systole demonstrating myocardial borders and computer-assisted tag line representation. The combination of short and long axis tag lines allows tracking of myocardial points in 3 dimensions.

Long axis image at end systole demonstrating myocardial borders and computer-assisted tag line representation. The combination of short and long axis tag lines allows tracking of myocardial points in 3 dimensions.