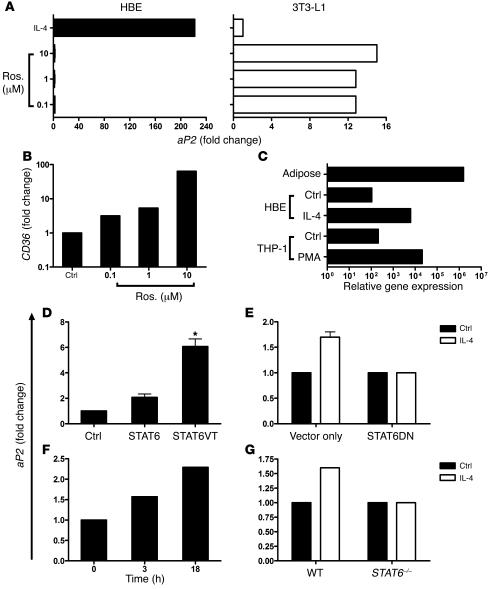
Figure 3. Differential expression and regulation ofaP2 expression by PPARγ activation in HBEs and adipocytes.
(A) HBEs and 3T3-L1 preadipocytes were treated with rosiglitazone (Ros.) or vehicle control and aP2 mRNA expression assessed. Data represent mean of 3 HBE and two 3T3-L1 experiments. (B) CD36 message levels were determined in HBEs after rosiglitazone treatment. Data represent mean of 2 experiments. (C) Relative abundance of aP2 message from 100 ng RNA was compared among human adipose tissue, HBEs, HBEs plus IL-4, THP-1 monocytes, and THP-1 monocytes plus PMA. (D) Transient transfection of BEAS-2B cells with WT STAT6, constitutively active STAT6 mutant (STAT6VT), or empty vector plasmids for 72 hours. aP2 expression was monitored by real-time PCR. Data represent mean ± SEM of 3 experiments. *P < 0.05 compared with vector control. (E) Transient transfection of BEAS-2B cells with STAT6 dominant negative (STAT6DN) or empty vector plasmids. Twenty-four hours after transfection, cells were treated with IL-4 for 18 hours, and aP2 transcript was quantified. Data represent mean ± SEM of 4 experiments. (F) Time course of aP2 expression in WT AECs after 3 or 18 hours treatment with IL-4 and TNF-α. Data represent the mean results from 2 independent cultures. (G) STAT6-deficient AECs were cultured in vitro and treated with IL-4 for 18 hours, and aP2 mRNA expression was assessed. Data represent the mean results of 2 independent cultures.

