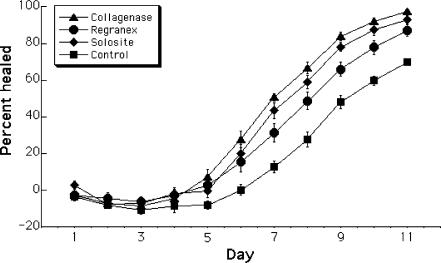
Figure 2.
Percentage healing of in vivo wounds. This chart shows the average percentage of wound closure, based on the original wound area, on each day of the experimental treatment with Clostridial collagenase, Regranex, Solosite, or a dry, sterile gauze control (n = 16 for each condition). Error bars represent the standard error of the mean. Beginning on Day 6, when healing began to result in a decreased wound size, there was a statistically significant difference among the treatment groups (analysis of variance, P < .05), and between each individual treatment and the sterile gauze control (Tukey test, P < .05). From Day 7 onwards, the difference between collagenase and each of the other 2 treatments is also significant (Tukey test, P < .05), though Solosite and Regranex did not differ significantly from each other.

