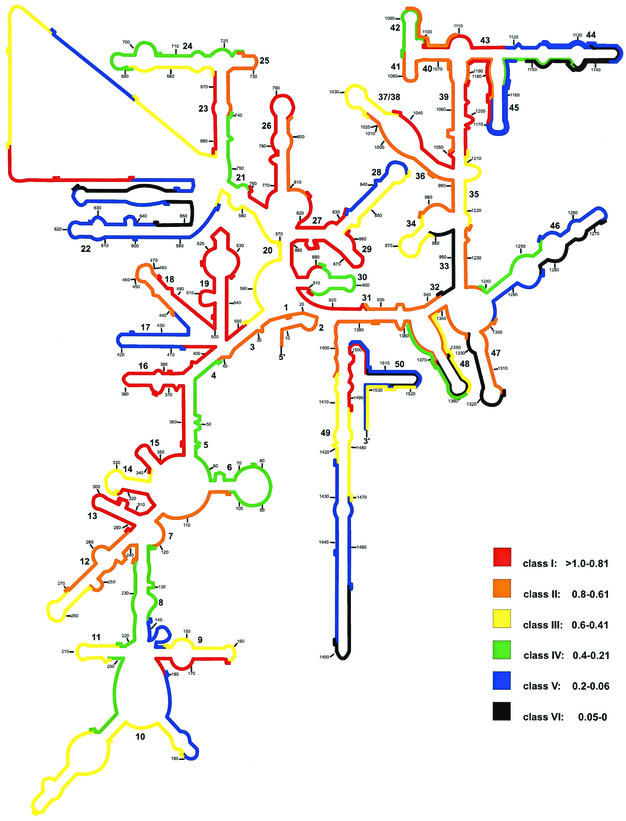
FIG. 4.
Distribution of relative fluorescence hybridization intensities of 112 oligonucleotide probes targeting the 16S rRNA of S. cerevisiae. The different colors indicate different brightnesses (classes I through VI). Numbers in small type indicate nucleotide positions. Numbers in larger type reflect helix numbering according to Brosius et al. (3).

