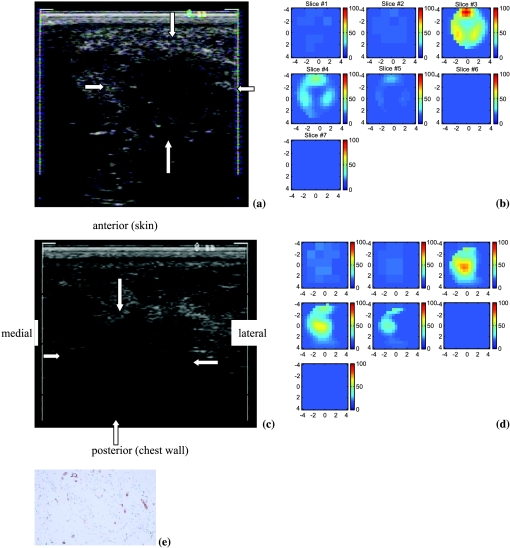
Figure 1.
(a) US image of a 4 x 4-cm high-grade invasive ductal cancer. (b) Total hemoglobin concentration of the lesion. Slice 1 is an x-y image of 9 x 9 cm obtained at 0.2 cm depth from the skin surface, and slice 7 is 3.2 cm deep toward the chest wall. The order of slices is from left to right and from top to bottom. The spacing between the slices is 0.5 cm. The vertical scale (mol/l) ranges from 0 to 100 µmol/l. (c) US image of the same cancer treated with chemotherapy for 3 months. (d) Total hemoglobin concentration of the lesion and the vertical scale (mol/l) ranging from 0 to 100 µmol/l. (e) Representative section of the infiltrating ductal carcinoma of the breast demonstrating high microvessel density (original magnification, x200; anti-human von Willebrand factor, DAKO EnVision plus).

