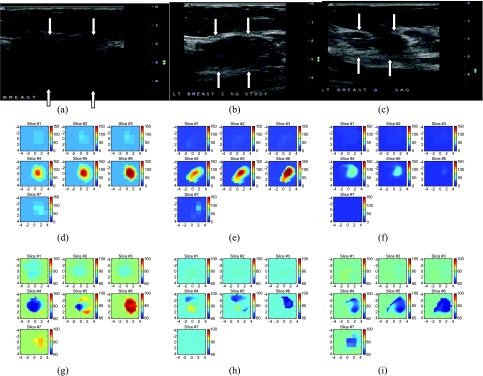
Figure 4.
Corresponding US images acquired at the beginning (a), after four cycles (b), and after eight cycles (c) of chemotherapy. (d–f) Corresponding NIR hemoglobin concentrations. (g–i) Oxygen saturation maps. Slice 1 is an x-y image of 9 x 9 cm obtained at 0.5 cm depth from the skin surface, and slice 7 is 3.5 cm deep toward the chest wall. The slices in (d)–(l) are numbered from left to right and from top to bottom.

