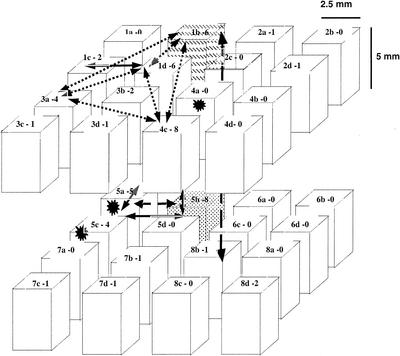
FIG. 1.
Spatial distribution of positive VUs in the 1-cm3 cube. The names of each subcube and the numbers of isolates obtained in the subcube are given as “name-number” at the top of each cube. The spatial spread of the clones (identical ribotype) is also indicated. Stars represent the positions of clonemates found in a single VU. The dashed subcubes contained clonemates. Otherwise, identical ribotypes are joined by arrows.

