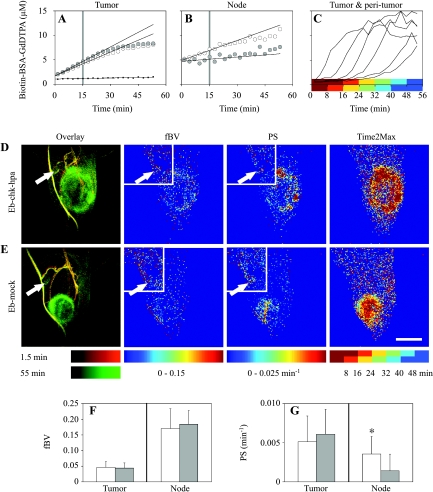
Figure 2.
Blood volume, vascular permeability, and interstitial flow of primary Eb tumors and draining lymph nodes. (A and B) Typical concentration curves for tumor region and popliteal lymph node of mice inoculated with Eb-chk-hpa (white circles) or Eb-mock (gray circles) tumors and for normal tissue away from the tumor (black dots). Linear fit of the first 15 minutes (trend lines) was used for derivation of blood volume fraction (fBV; tissue concentration at time zero divided by blood concentration) and permeability surface area product (PS; the slope of concentration curve normalized to blood concentration). (C) Contrast accumulation curves of different tumor and peritumor regions. Color-coded semioverlapping time intervals of delayed accumulation of contrast material used for mapping interstitial flow (Time2Max). (D and E) Representative overlay MIPs (1.5 minutes in red; 55 minutes in green), fBV, PS, and Time2Max map 8 days after inoculation of tumors. Tumor slices, large frame; popliteal slices, small frame. Arrows indicate the popliteal lymph node. Scale bar = 5 mm. (F and G) fBV and PS values were calculated for each mice by linear regression, after averaging the concentration of contrast material in the selected regions of interest (tumor or popliteal lymph node) from all relevant concentration maps. Values (mean ± SD) for Eb-chk-hpa (white bars; n = 19) and Eb-mock (gray bars; n = 10). *Indicates two-tailed unpaired t test (P = .02).

