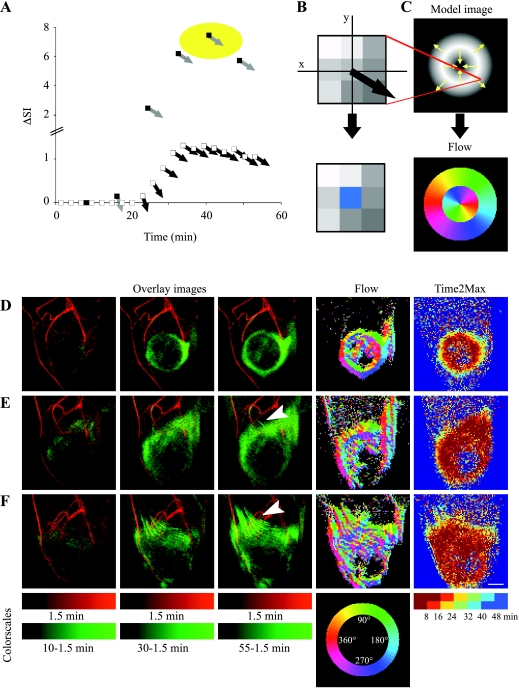
Figure 5.
Patterns of interstitial convection and flow. (A) Tracking the temporal changes in the direction of the signal intensity gradient (determined in the central pixel of 3 x 3 matrices; see Materials and Methods section). Signal intensity gradient in MIP images was assigned magnitude (DSI; white squares) and direction black arrows) and then summed for each of six semioverlapping intervals (black squares, gray arrows). (B) The corresponding pixel in the flow map was assigned the angle obtained at the time interval with the highest-magnitude change (marked by yellow circle in A) color-coded with radial color scale (see below). (C) Flow analysis was simulated on a model image with inward and outward intensity gradients (indicated by arrows), resulting in a flow map. (D and F) Experimental MR datasets of three representative mice presented as overlays of MIPs of the first postcontrast time point (1.5 minutes; red) and later time points (after subtraction of the first time point; green). Arrowheads indicate draining channels. Such MIPs were used for generation of flow maps. Time2Max maps were generated from concentration maps (see Materials and Methods section). Flow maps varied from almost uniform interstitial convection (D; Eb-chk-hpa) to moderate (E; Eb-chkhpa) and massive (F; Eb-mock) channeling of contrast material. Scale bar = 2.5 mm (see also movies in supplementary data).

