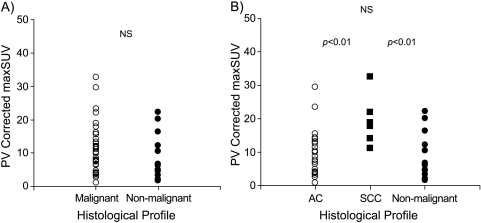
Figure 1.
pSUV values plotted with respect to tumor histologic diagnosis. (A) The pSUVs were higher for malignant lesions (mean ± SD, 10.9 ± 7.3) than that for nonmalignant lesions (8.0 ± 6.3) (NS). (B) The SCC showed the highest pSUV (mean ± SD, 19.5 ± 7.50) (ANOVA, P < 0.01). The AC lesions had higher pSUVs than that for nonmalignant lesions (NS). AC, adenocarcinoma of the lung; SCC, squamous cell carcinoma of the lung.

