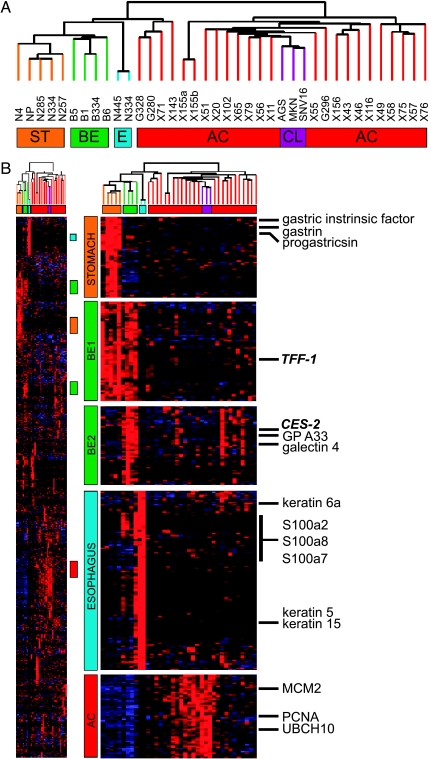
Figure 1.
Agglomerative clustering analysis. Analysis of the molecular profiles generated using agglomerative clustering demonstrating a strong relationship between normal, neoplastic, and BE specimens (panel A). The far right column lists representative genes predominantly expressed in each of the tissue types (panel B). ST = stomach; BE = Barrett's esophagus; E = esophagus; AC = adenocarcinoma; CL = cell line.

