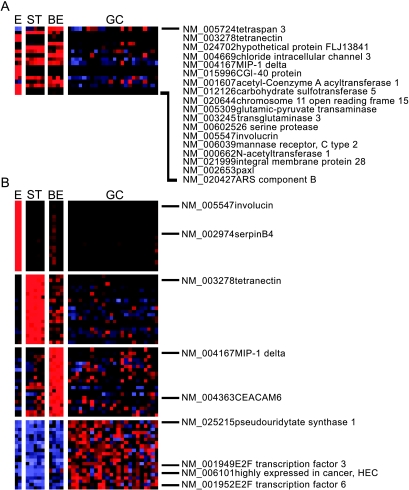
Figure 2.
Supervised classification of tissue specimens. Tissue samples were divided into four groups (E = esophagus, ST = stomach, BE = Barrett's esophagus, GC = adenocarcinoma) and subjected to supervised learning using k-NN. The 18 genes in panel A are those that were used in all models to correctly predict all of the tissue samples correctly. Panel B depicts the 20 genes per group best correlated with the distinction between the four types of tissue with a S2N ranking metric.

