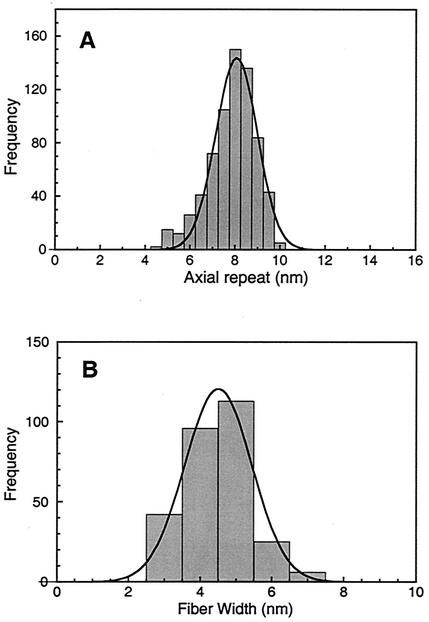
FIG. 4.
(A) Distribution of axial repeats along fibrils and ribbons measured directly from transmission electron micrographs of negatively stained preparations. (B) Distribution of projected width as measured directly on isolated fibrils. These values are consistent with the diffraction data in Fig. 2 and 3.

