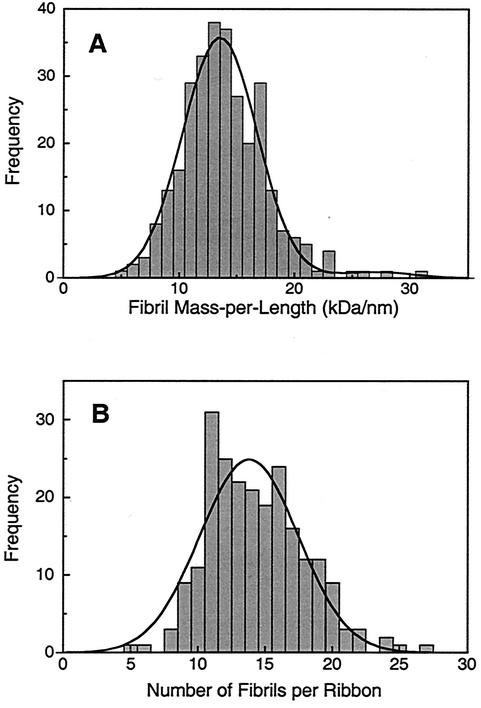
FIG. 7.
(A) Measured distribution of mass per length for isolated fibrils, which is well fit by a prominent Gaussian corresponding to single fibrils (13.5 kDa/nm) plus a very weak Gaussian corresponding to residual component of paired fibrils (27 kDa/nm). (B) Measured distribution of fibrils per ribbon as deduced from STEM mass analysis by assuming that each fibril has a mass per length of 13.5 kDa/nm.

