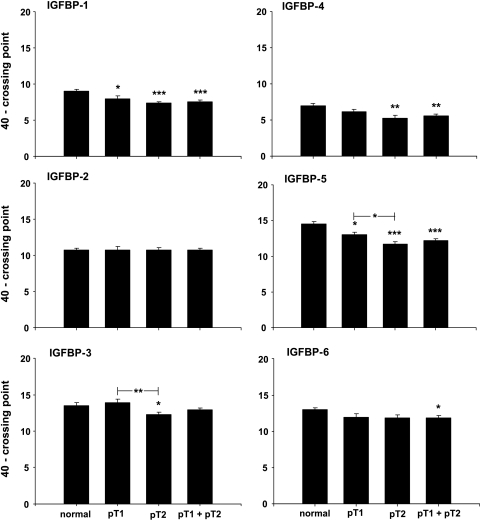
Figure 3.
Expression data (mRNA) for IGFBP-1, IGFBP-2, IGFBP-3, IGFBP-4, IGFBP-5, and IGFBP-6 in normal testicular tissue and pT1, pT2, and pT1 + pT2 stages of seminoma. Data are shown as a maximal cycle number of 40 minus the acquired crossing point (40 - CP) ± SEM. Significance is indicated as follows: *P < .05, **P < .01, and ***P < .001.

