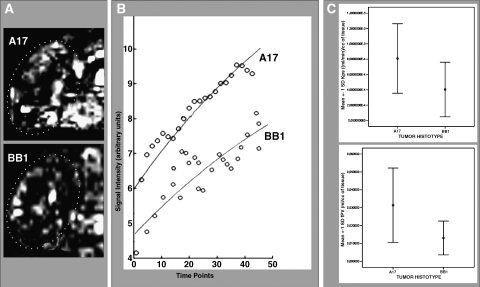
Figure 3.
In vivo assessment of BB1 and A17 tumor vasculature by DCE-MRI with Gd-DTPA-albumin. A series of quadrangular ROIs matching the whole tumor section was manually selected on the MRI images (A), and was analyzed as previously described [20] to measure the fractional vascular volume (fPV) and transendothelial permeability (kPS) of tumor vessels. The first parameter is dependent on the intercept between the curve and the y-axis; the latter depends on the slope of the curve (B). Both parameters proved significantly higher, on average, in A17 than in BB1 tumors (C; see also Table 1).

