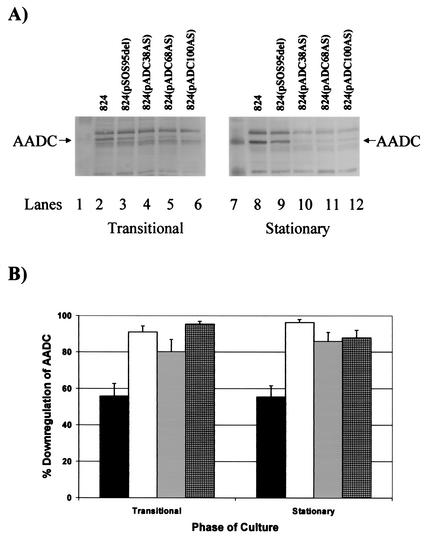
FIG. 2.
Downregulation of AADC in C. acetobutylicum adc-asRNA-expressing strains. (A) AADC Western blots from the transitional and stationary phases of fermentation. AADC bands as well as the closest marker bands are indicated for both blots. The culture phase from which the samples on each blot were taken is indicated below each blot. Lanes: 1, kaleidoscope-prestained marker from Bio-Rad Laboratories; 2, ATCC 824; 3, ATCC 824(pSOS95del); 4, ATCC 824(pADC38AS); 5, 824(pADC68AS); 6, 824(pADC100AS); 7, biotinylated protein marker from the horseradish peroxidase protein marker detection pack from New England Biolabs; 8, ATCC 824; 9, ATCC 824(pSOS95del); 10, ATCC 824(pADC38AS); 11, ATCC 824(pADC68AS); 12, ATCC 824(pADC100AS). (B) Percent downregulation of AADC in C. acetobutylicum adc-asRNA-expressing strains. The percent downregulation was calculated as the percent decrease of AADC gel band intensity in ATCC 824(pSOS95del) (▪), ATCC 824(pADC38AS) (□), ATCC 824(pADC68AS) (igwidth>), and ATCC 824(pADC100AS) (igwidth>) compared to that of the parental strain at the same culture phase in Western blots. The standard error of measurement was calculated from two to four different blots.

