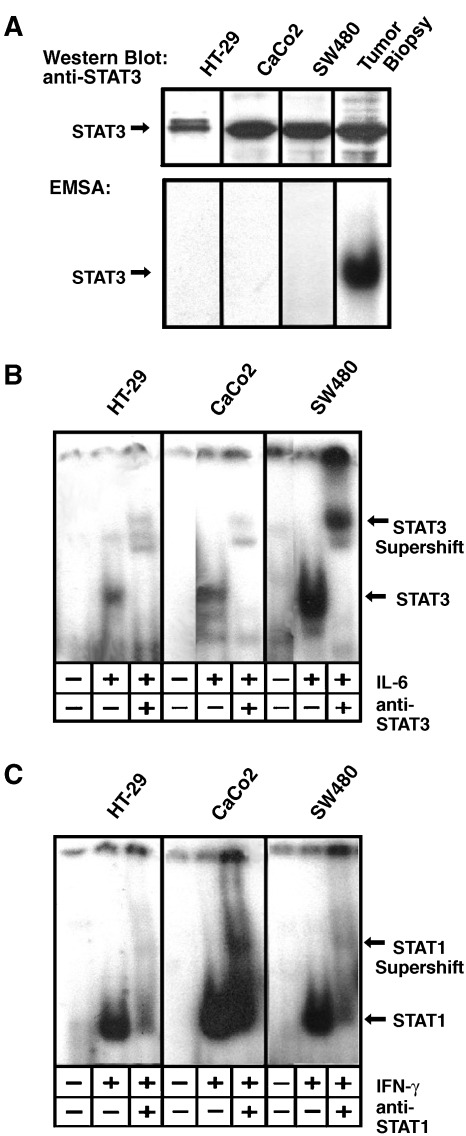
Figure 3.
Analysis of the STAT activity status in colon carcinoma cell lines. (A) Western blot analysis (top) and EMSA analysis (bottom) of cell lines HT-29, CaCo2, and SW 480. A STAT3-positive tumor sample (compare Figure 1) served as a positive control. STAT3 expression was tested by subjecting cell extracts to a Western blot probed with anti-STAT3. STAT3 activation was analyzed by assaying for the formation of specific complexes on the SIE m67 DNA binding site. (B) Test for IL-6-inducible activation of STAT3 in cell lines HT-29, CaCo2, and SW 480. Cells were either left untreated or incubated with 10 ng/ml IL-6 for 30 minutes as indicated. Lysates were subjected to an EMSA using the m67 element as a probe. The identity of STAT3-containing complexes was verified by supershift experiments employing an antibody to STAT3 as indicated. Positions of STAT3 and STAT3-DNA complexes are marked with arrows. (C) Test for IFN-γ-inducible activation of STAT3 in cell lines HT-29, CaCo2, and SW 480. Cells were either left untreated or incubated with 10 ng/ml IFN-γ for 30 minutes as indicated. Lysates were analyzed as in (B), using an antibody to STAT1 for supershift experiments as indicated. Positions of STAT1 and STAT1-DNA complexes are marked with arrows.

