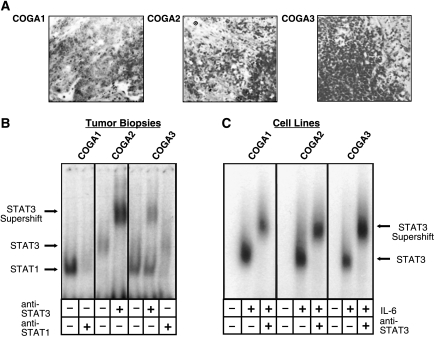
Figure 4.
Comparative analysis for STAT3 activity in colon carcinoma tissue and low passage colon cell lines derived from the respective tumors. (A) Histologic representation (methylene blue staining) of sections from tumors that were analyzed for STAT3 activity in (B) and gave rise to the COGA cell lines studied in (C). (B) EMSA of samples from tumors that gave rise to the COGA cell lines studied in (C). The SIE m67 STAT binding element was used as a probe; supershift experiments were performed by employing an antibody to STAT3 as indicated. Arrows mark the positions of the respective complexes. Only portions of the biopsies were processed for sample preparation that had previously been confirmed as cancerous by histologic examination of flanking sections (compare A). (C) EMSA analysis of cell lines originating from the tumors assayed in (A) and (B). Cells were either left quiescent or stimulated with 10 ng/ml IL-6 before lysis and treatment as in (B).

