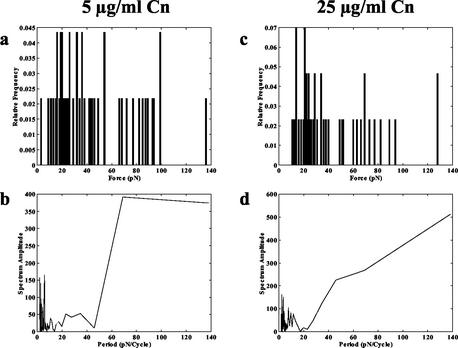
FIG. 3.
(a) Histogram of detachment forces between S. aureus Phillips MSCRAMMs and 5 μg of Cn/ml. The initial contact time between the cell and microsphere before detachment process was 10 s. (b) Periodogram for frequency analysis of S. aureus Phillips detachment forces from 5 μg of Cn/ml. The periodogram does not have any distinct peaks. Descriptions for panels c and d are similar to those for panels a and b, respectively, except that the Cn coating concentration was 25 μg/ml.

