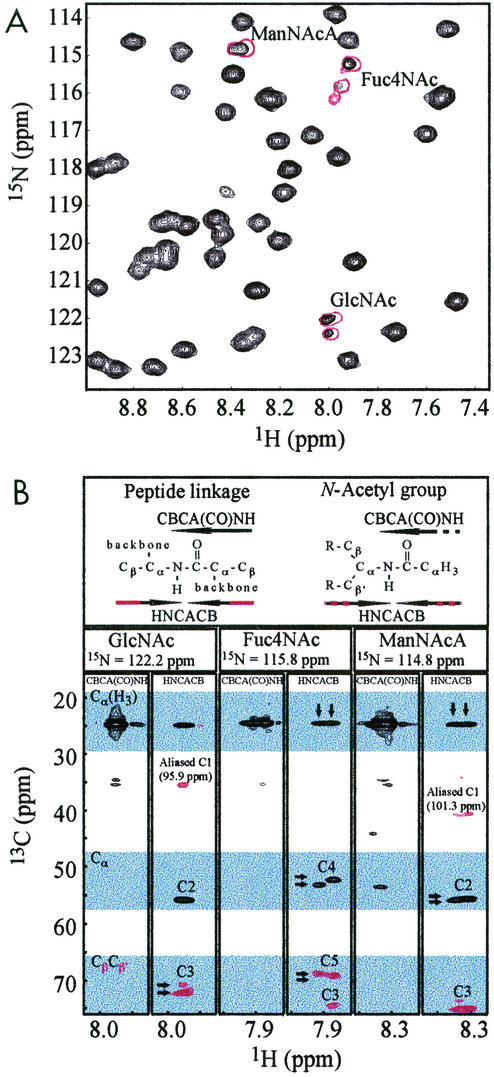
FIG. 2.
Identification of nonprotein amide resonances. (A) Expansion of the 1H-15N HSQC spectrum of HIFd with copurified ECA (black) and HPLC purified ECA (red). Signals from the amides of the N-acetyl groups of ECA are characterized by notably narrow line widths and signal doubling compared to protein signals. (B) CBCA(CO)NH and HNCACB strips for each N-acetyl group of ECA. Black and red indicate positive and negative cross peaks, respectively. These spectra correlate carbon resonances with the amide 15N and 1H shifts. In particular, the CBCA(CO)NH experiment gives a positive cross peak between the Cα-like site to the carbonyl (Cα[H3]). The HNCACB experiment shows positive cross peaks for the same Cα-like site (Cα[H3]) and the Cα-like site with respect to the HN (Cα) with the same amide. In addition, negative cross peaks are observed in the HNCACB experiment for the Cβ-like signals (see header). Note that the Cβ-like anomeric signals (≈100 ppm) occur outside of the chemical shift range of the 13C dimension (15 to 75 ppm) and are aliased into this range near 40 ppm. Arrows indicate the characteristic signal doubling of ECACYC signals, the origin of which may be sample heterogeneity or slow time scale dynamics (see Discussion).

