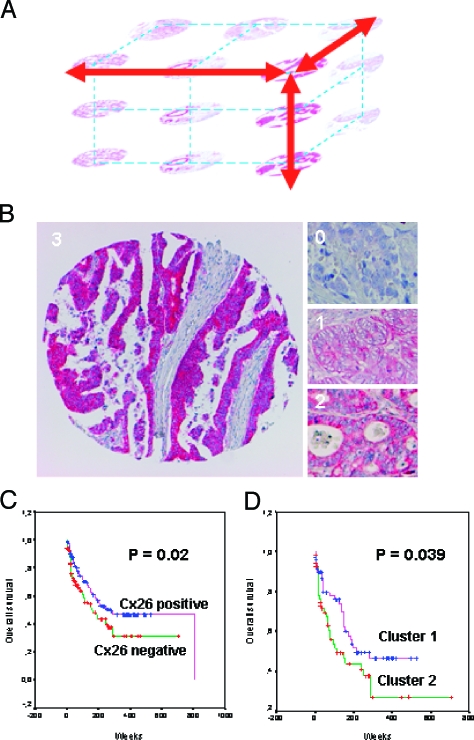
Figure 1.
(A) Illustration of the 3D analysis of a tumor using TMAs. By sectioning one core, adjacent areas of a carcinoma potentially representing the same tumor cell clone are analyzed for multiple markers. (B) Examples of the immunohistochemical assessment of Cx26 staining in CRCs using TMAs. Negative staining of tumor cells (0), weakly positive (1), moderately positive (2), and strongly positive (3) (original magnification, x50 magnification). (C) Kaplan-Meier plot comparing disease-specific survival in patients with Cx26-positive colorectal tumors (n = 178) and patients with Cx26-negative tumors (n = 124) (P = .02). (D) Kaplan-Meier plot comparing disease-specific survival in cluster 1 “high tumor stage cluster” and cluster 2 “shorter survival cluster” (P = .039).

