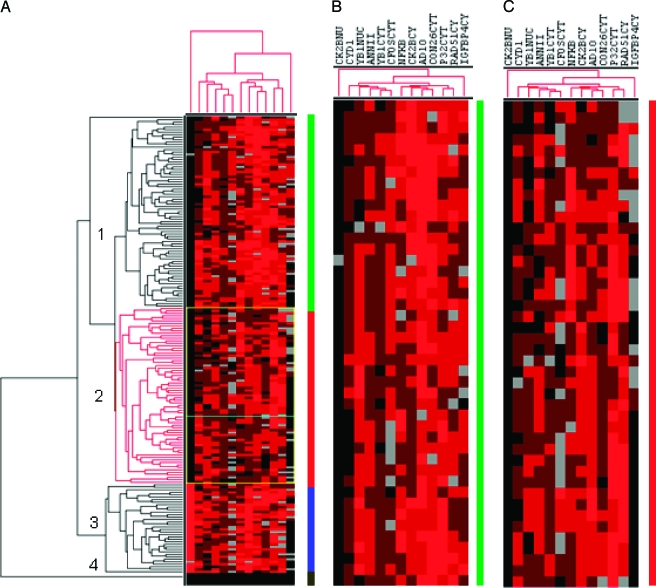
Figure 2.
(A) Hierarchical cluster analysis of CRC TMA immunostaining results. For each of the antibodies indicated at the top of the figure, strong positive staining is indicated by a red square, moderate staining by a light brown, weak positive staining by dark brown, absence of staining as black, and no available data as grey. The dendogram at the top shows the clustering of antibodies based on the relatedness of tumors stained by each antibody. The dendogram on the left side shows the clustering of the tumors based on the degree of similarity of their immunohistochemical staining results. (B) Enlarged portion from the so-called “high tumor stage cluster” with prominent Adam10 staining (see vertical line). (C) Enlarged portion of the “shorter survival stage cluster” with prominently reduced Cx26 staining (see vertical line). Number and different colors: cluster group 1 (green), cluster group 2 (red), cluster group 3 (blue), cluster group 4 normal tissue (black).

